Top Datadog Alternatives for Cloud Monitoring in 2025
Best Datadog alternatives in 2025 are:
New Relic
Prometheus
Grafana
Splunk
AppDynamics
LogicMonitor
Dynatrace
Zabbix
In today's dynamic IT monitoring and analytics landscape, finding a reliable alternative to Datadog is essential for organizations seeking to optimize their system performance and gain real-time insights. Whether you're looking for more flexible pricing, deeper analytics, or specialized application performance monitoring (APM) capabilities, the alternatives listed below offer a variety of features tailored to meet diverse needs. This guide explores the top Datadog alternatives, comparing their strengths and weaknesses to help you make an informed decision for your monitoring strategy. Many of these alternatives not only match Datadog in comprehensive monitoring capabilities but also excel in synthetic monitoring, ensuring robust coverage across all critical aspects of IT infrastructure.
Table of Contents
Why Do You Need Alternatives to Datadog?
Alternatives to Datadog are essential because one size never fits all. As your organization expands, your machine generated data monitoring and analytics needs evolve, and a singular solution like Datadog may not offer the flexibility required for your unique environment. Exploring an open source monitoring system can provide the adaptability to analyze logs effectively. Additionally, considering a cloud based monitoring option could enhance your ability to scale and customize solutions as your business needs change.
Key Reasons to Explore Alternatives:
Customization: Alternative platforms often allow for deeper configuration and tailored dashboards that align more precisely with your operational processes.
Cost-Effectiveness: With varying pricing models, some alternatives can provide more predictable and affordable cost structures, especially as data volumes and user counts increase.
Specialized Tools: Depending on your specific industry or infrastructure, other tools might offer specialized integrations or features that Datadog doesn’t cover.
Scalability: As demands grow, having a monitoring solution that scales with your organization without excessive overhead is critical. Exploring different options ensures you can adapt to changing needs.
Who Should Consider Using Datadog Alternatives?
Organizations seeking monitoring solutions that precisely match their unique needs must consider Datadog alternatives. Whether you're a startup, a mid-sized company, or an enterprise, these alternatives offer tailored features for analyzing machine-generated data, tracking business metrics, and incident management, which can significantly enhance system performance and cost management. They are also adept at cloud infrastructure monitoring, ensuring comprehensive oversight across all your systems.
IT Teams Focused on In-depth Analytics
For IT teams that require detailed performance metrics and comprehensive analytics, alternatives like New Relic and Dynatrace offer extensive data visualization and analysis capabilities that can help optimize system performance.
Developers Requiring Open-Source Flexibility
Developers who prefer customizable and open-source monitoring solutions may find platforms like Prometheus and Grafana particularly appealing due to their flexibility and community-driven enhancements.
Enterprises Needing End-to-End Monitoring
Large enterprises looking for comprehensive monitoring across multiple environments will benefit from solutions like Splunk and AppDynamics, which offer end-to-end visibility and robust integration with enterprise IT ecosystems.
Organizations Seeking Cost-effective Solutions
For businesses that are budget-conscious yet require reliable monitoring, alternatives such as LogicMonitor and Zabbix provide cost-effective solutions without compromising on critical features.
Datadog Alternatives Comparison Table
| Feature | New Relic | Prometheus | Grafana | Splunk | AppDynamics | LogicMonitor | Dynatrace | Zabbix |
|---|---|---|---|---|---|---|---|---|
| Ease of Use | Easy | Moderate | Easy | Moderate | Moderate | Easy | Easy | Moderate |
| Pricing | Paid Plans | Free & Paid | Free & Paid | Paid | Paid | Paid | Paid | Free & Paid |
| Platform Support | Cloud & On-Prem | Cloud & On-Prem | Cloud & On-Prem | Cloud & On-Prem | Cloud & On-Prem | Cloud-based | Cloud & On-Prem | On-Prem |
| Collaboration Features | Extensive | Basic | Moderate | Extensive | Extensive | Moderate | Extensive | Basic |
| Special Features | Real-Time Analytics | Open-Source Monitoring | Custom Dashboards | Big Data Analysis | Application Performance | Automated Alerts | AI-Powered Insights | Customizable Alerts |
Best Datadog Alternatives
For businesses seeking enhanced monitoring solutions, exploring Datadog alternatives can be a smart move. Additionally, our analysis of Tableau alternatives offers fresh insights into visualizing and interpreting data more effectively.
The platforms below provide a range of solutions from comprehensive, enterprise-grade monitoring to flexible open-source tools that can be customized to your needs. Read on for a detailed review of each alternative.
1. New Relic
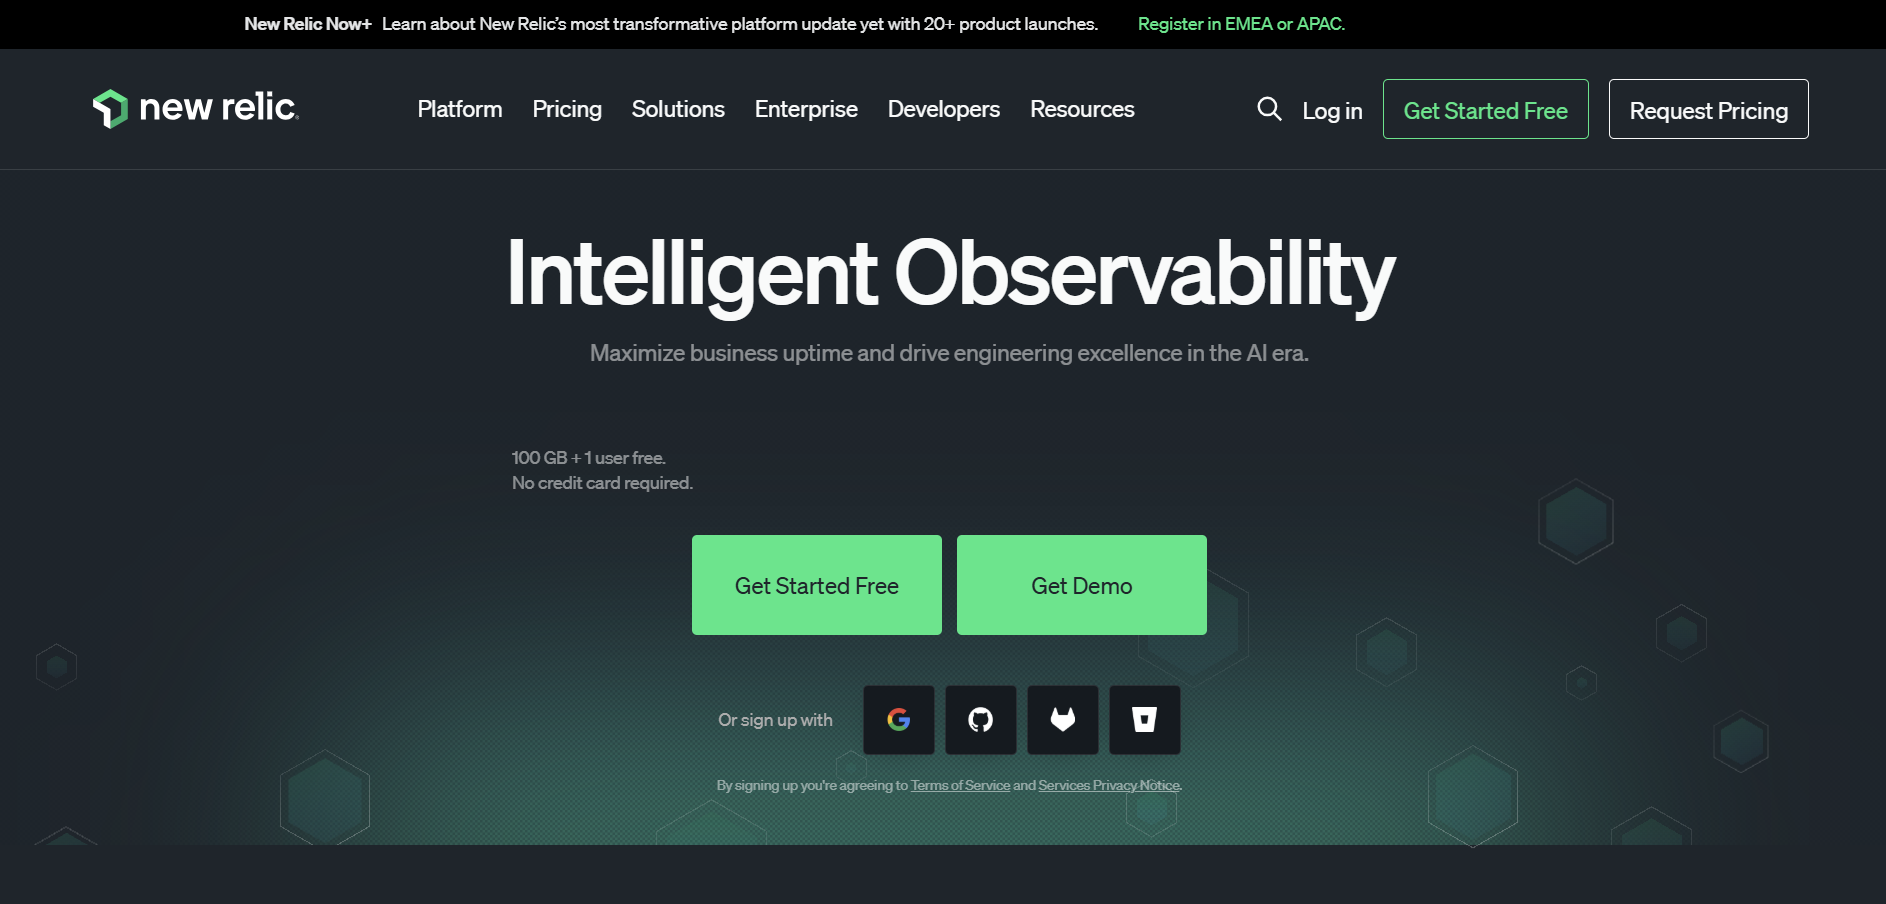
New Relic is a powerful performance monitoring solution designed for modern, cloud-based applications. It offers a robust set of tools that deliver real-time analytics and insights to help you optimize your application's performance and troubleshoot issues quickly. With features like real user monitoring, automatic discovery, and application monitoring, New Relic provides comprehensive visibility into your software environment.
New Relic vs Datadog
New Relic provides a comprehensive monitoring solution with an emphasis on application performance and real-time analytics. While Datadog is known for its extensive integrations and unified monitoring, New Relic focuses on deep application insights and user experience analytics.
Key Features of New Relic
Real-time performance monitoring
Deep application diagnostics
Customizable dashboards
End-to-end transaction tracing
Integration with numerous cloud platforms
New Relic Pros
Extensive analytics capabilities
User-friendly interface
Robust support for modern application architectures
Comprehensive alerting and reporting features
Scalable for enterprise needs
New Relic Cons
Higher pricing for full-featured plans
Complex setup for smaller environments
Steep learning curve for new users
May require significant configuration for optimal use
Limited on-premises support compared to some alternatives
New Relic Pricing
New Relic offers a usage-based pricing model. They provide 100 GB of free data ingest per month, after which charges apply based on the data plan. The standard data plan costs $0.30 per GB ingested ($0.35 per GB for EU region data centers).
New Relic Core user pricing starts at $49 per month for the Standard edition, with Pro and Enterprise editions offering custom pricing12. The platform also offers a Data Plus option at $0.50 per GB ingested ($0.55 per GB for EU region).
2. Prometheus
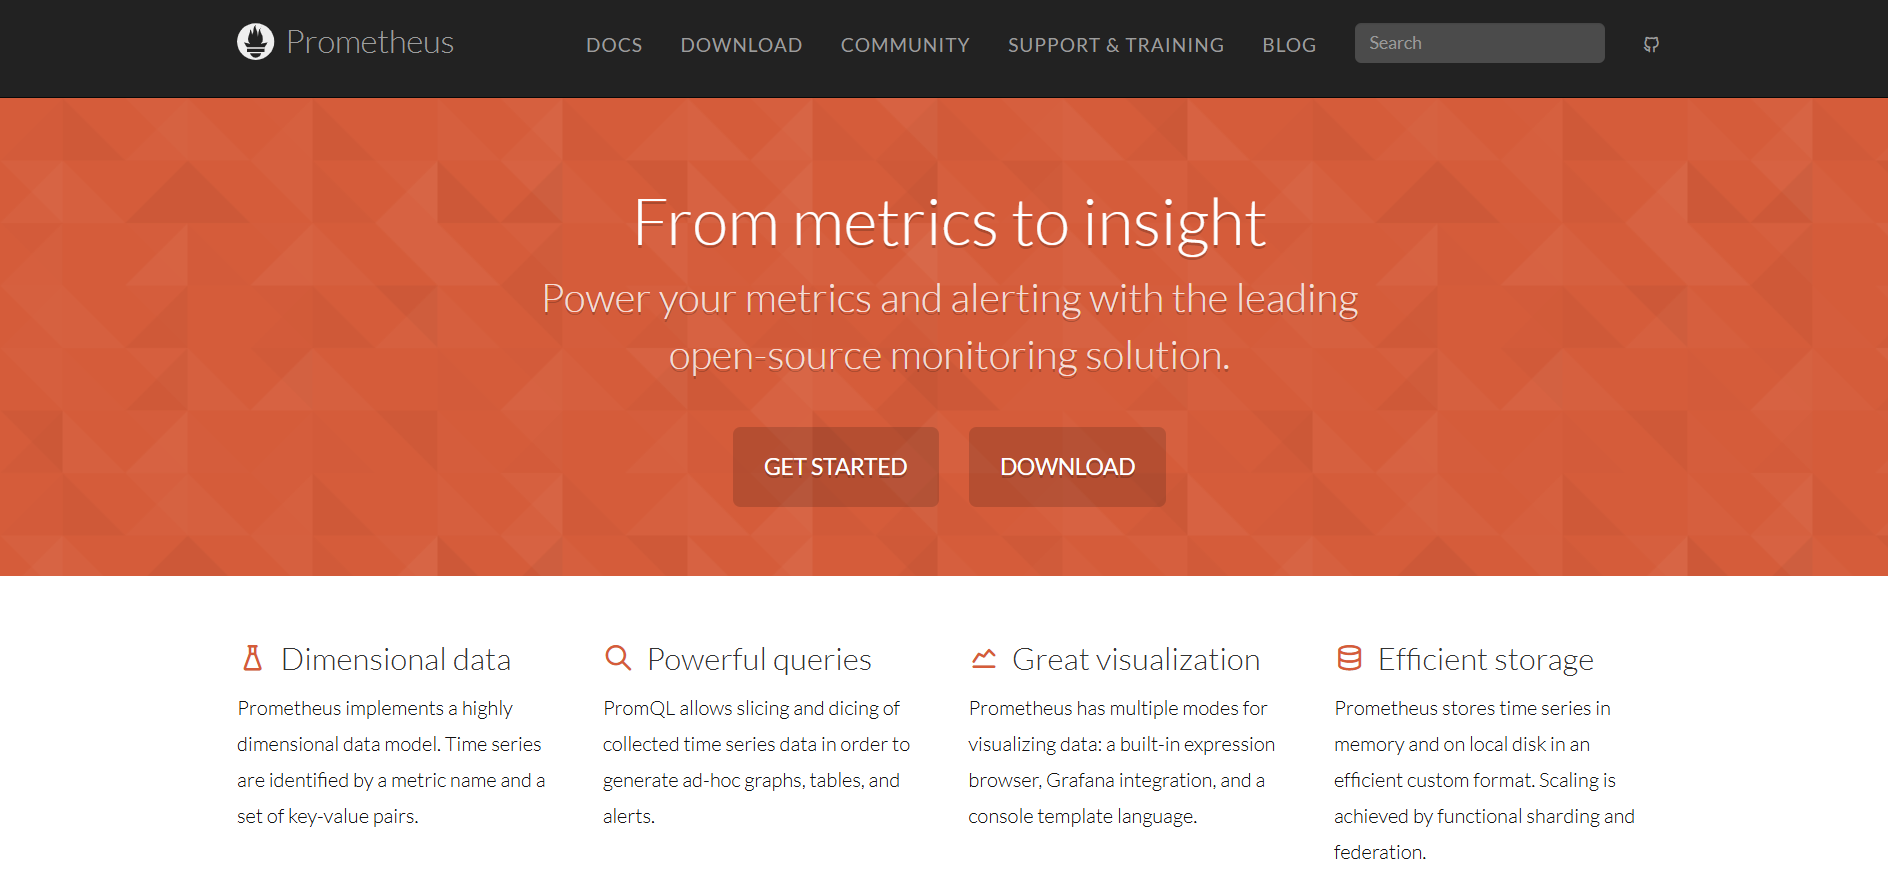
Prometheus is an open-source monitoring and alerting toolkit widely used for containerized and microservices architectures. It is highly customizable and integrates seamlessly with many modern systems, making it a popular choice for developers and DevOps teams.
Prometheus vs Datadog
Prometheus focuses on providing an open-source, highly flexible monitoring solution. Unlike Datadog, which is a proprietary, full-service monitoring platform, Prometheus allows for complete customization, making it ideal for organizations with the technical expertise to manage and extend their monitoring systems.
Key Features of Prometheus
Powerful query language (PromQL)
Efficient time-series database
Customizable data collection and alerting
Seamless integration with Kubernetes
Active open-source community support
Prometheus Pros
Open-source and free
Highly customizable
Excellent for containerized environments
Strong community and documentation
Scalable for large deployments
Prometheus Cons
Requires manual configuration and management
Steeper learning curve for complex queries
Limited built-in visualization (often paired with Grafana)
May require additional tools for comprehensive monitoring
Less user-friendly for non-technical users
Prometheus Pricing
Prometheus itself is free and open-source. However, there are various pricing models in the Prometheus ecosystem. Self-hosted Prometheus is free, with users only paying for infrastructure and maintenance. Managed services offered by cloud providers have different pricing tiers.
For example, Amazon Managed Service for Prometheus charges $0.30 per million samples ingested, $0.03 per GB-month of metric data stored, and $0.01 per million samples scanned for queries.
3. Grafana
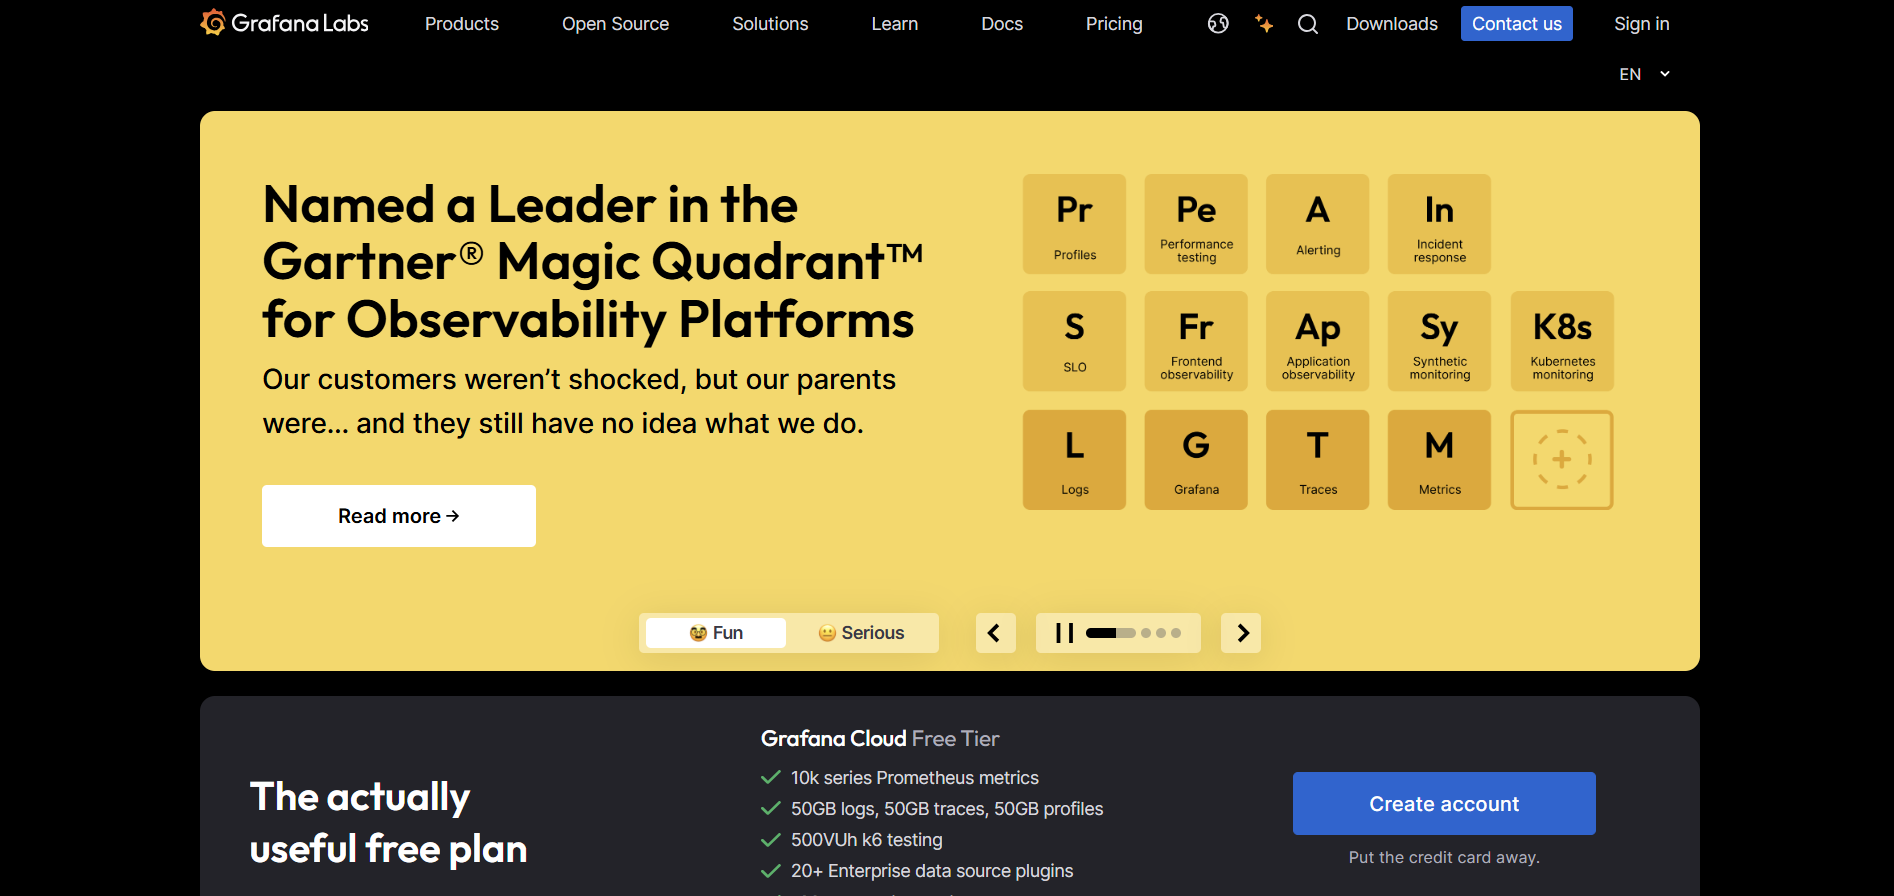
Grafana is a leading open-source analytics and interactive visualization platform. Often used alongside Prometheus, it excels in creating customizable, real-time dashboards that provide clear insights into system performance and data trends.
Grafana vs Datadog
Grafana specializes in data visualization and dashboarding. Unlike Datadog, which offers an all-in-one monitoring solution, Grafana focuses on presenting data in an interactive and customizable manner, often integrating with various data sources to provide a unified view of system metrics.
Key Features of Grafana
Customizable, interactive dashboards
Support for multiple data sources
Alerting and notifications
Rich plugin ecosystem
Open-source with enterprise options
Grafana Pros
Highly flexible and customizable
Excellent data visualization capabilities
Active open-source community
Seamless integration with various monitoring tools
User-friendly interface
Grafana Cons
Primarily focused on visualization, not full monitoring
Requires integration with other data sources for complete monitoring
May need technical expertise for advanced customization
Limited built-in alerting compared to dedicated tools
Some enterprise features require a paid license
Grafana Pricing
Grafana offers both free and paid options. The open-source version (Grafana OSS) is free. Grafana Cloud has a free tier with limits on metrics, storage, and users. Paid tiers include Pro, Advanced, and Enterprise, with pricing based on active users and data volume.
For example, Grafana Cloud Visualization costs $15 per monthly active user for the base version, while Grafana Cloud Metrics is priced at $8 per 1,000 billable series for low resolution and $16 for high resolution.
4. Splunk
Splunk is a comprehensive data analytics and monitoring platform known for its ability to process large volumes of machine data. It provides powerful search, analysis, and visualization capabilities, making it ideal for organizations that require in-depth insights from their IT data.
Splunk vs Datadog
Splunk is renowned for its big data analytics and log management capabilities. While Datadog excels in monitoring and performance analytics, Splunk offers a broader suite of data processing and security analytics tools, making it well-suited for organizations with complex IT environments.
Key Features of Splunk
Robust log management and analytics
Advanced search and visualization capabilities
Real-time data processing
Extensive integration options
Security and compliance monitoring
Splunk Pros
Exceptional data processing capabilities
Powerful search and analysis tools
Highly scalable for large enterprises
Comprehensive security analytics
Extensive documentation and support
Splunk Cons
High cost for full-featured deployments
Complex setup and configuration
Steep learning curve for new users
Resource-intensive
May be overkill for smaller environments
Splunk Pricing
Splunk offers multiple pricing models. Their ingest-based pricing starts at approximately $1,800 annually for 1GB/day of data ingestion, with prices ranging from $1,800 to $18,000 per year for 1-10 GB/day. Splunk also offers workload-based pricing, where charges are based on compute capacity consumed, measured in Splunk Virtual Compute (SVC) units for cloud deployments or vCPUs for on-premises installations.
Additionally, Splunk has implemented a standard uplift policy for renewals, with annual net pricing increases of 9% for 1-year renewals, 7% per year (compounded annually) for 2-year renewals, and 5% per year (compounded annually) for 3-year renewals.
5. AppDynamics
AppDynamics is an application performance monitoring solution that delivers deep insights into application performance and user experience. It is designed to help businesses proactively identify and resolve performance issues before they impact end-users.
AppDynamics vs Datadog
AppDynamics focuses on providing detailed insights into application performance and end-user experience. While Datadog offers a unified monitoring solution across infrastructure and applications, AppDynamics specializes in application performance management, making it ideal for organizations that prioritize application-level insights.
Key Features of AppDynamics
End-to-end application performance monitoring
Real-time business transaction monitoring
Root cause analysis and diagnostics
Customizable dashboards and reporting
Integration with various IT systems
AppDynamics Pros
Comprehensive application insights
Proactive performance monitoring
User-friendly interface
Robust diagnostic tools
Scalable for enterprise-level applications
AppDynamics Cons
Higher pricing compared to some alternatives
Complex setup for multi-tier applications
Steep learning curve for advanced features
May require significant configuration
Less focused on infrastructure monitoring
AppDynamics Pricing
AppDynamics offers several pricing tiers based on the number of units licensed. For 1-10 units, the price is $3,300 per unit per year, while for 11-25 units, the cost reduces to $2,970 per unit per year12. The company provides a free Lite version for a single application and a Pro version for enterprises.
The Pro version is available in various product modules, including End User Experience Monitoring, Application Performance Monitoring, Infrastructure, Database, and Application Analytics. Customers can license one or more modules depending on their monitoring needs.
6. LogicMonitor
LogicMonitor is a cloud-based infrastructure monitoring platform designed to provide full-stack visibility across IT environments. It offers comprehensive monitoring, alerting, and reporting capabilities for networks, servers, cloud services, and applications.
LogicMonitor vs Datadog
LogicMonitor delivers robust, end-to-end monitoring with a focus on infrastructure and performance management. Compared to Datadog, LogicMonitor provides extensive out-of-the-box integrations and customizable alerting, making it suitable for organizations that require detailed infrastructure monitoring.
Key Features of LogicMonitor
Comprehensive infrastructure monitoring
Automated discovery and configuration
Customizable dashboards and alerts
Cloud and on-premises support
Predictive analytics and reporting
LogicMonitor Pros
Extensive integration options
User-friendly cloud-based interface
Automated monitoring and alerting
Scalable for large environments
Detailed performance analytics
LogicMonitor Cons
Premium pricing for full-featured plans
May require time to configure advanced alerts
Less focused on application performance
Steep learning curve for beginners
Limited customization in lower-tier plans
LogicMonitor Pricing
LogicMonitor's pricing structure is not publicly disclosed, and customers are required to contact sales for a quote. The company offers two main plans: Pro Hybrid Monitoring and Enterprise Full Observability.
While specific pricing details are not available, some users have reported pricing between $5 and $7 per device, with a minimum of 100 agents. LogicMonitor's pricing is generally considered to be on the higher end compared to some alternatives, but customers can potentially negotiate discounts.
7. Dynatrace
Dynatrace is an AI-powered monitoring solution that provides full-stack observability, including infrastructure, applications, and user experience. It leverages advanced automation and machine learning to detect anomalies and optimize performance.
Dynatrace vs Datadog
Dynatrace offers a comprehensive, AI-driven monitoring platform that focuses on full-stack observability. While Datadog provides a wide range of integrations and monitoring tools, Dynatrace emphasizes automated root cause analysis and advanced analytics to streamline issue resolution.
Key Features of Dynatrace
AI-powered monitoring and analytics
Full-stack observability
Automated root cause analysis
Real-time performance monitoring
User experience insights
Dynatrace Pros
Advanced automation and AI capabilities
Comprehensive monitoring across all layers
User-friendly interface with detailed insights
Rapid anomaly detection
Scalable for enterprise environments
Dynatrace Cons
Higher pricing for full-featured solutions
Complex configuration for some environments
Steep learning curve for advanced features
May be resource-intensive
Premium support can be costly
Dynatrace Pricing
Dynatrace offers a Platform Subscription model with flexible pricing options. The cost is based on the number of monitored devices and the features included in the plan. Dynatrace provides full platform access, allowing users to utilize any observability, security, AIOps, and automation capability.
The pricing model includes a simple contract with an annual spend commitment and a straightforward rate card. Dynatrace does not charge hidden fees, and the same rates apply for committed and on-demand usage. For specific solutions, Full-stack Monitoring starts at $0.08 per hour for an 8 GiB host, while Infrastructure monitoring begins at $0.04 per hour for any size host.
8. Zabbix
Zabbix is an open-source monitoring solution that offers robust monitoring capabilities for networks, servers, applications, and services. It is highly customizable and ideal for organizations that have the expertise to manage and extend an open-source platform.
Zabbix vs Datadog
Zabbix provides a free, open-source alternative for organizations looking for a cost-effective monitoring solution. Unlike Datadog, which is a fully managed service, Zabbix requires self-hosting and customization, making it best suited for teams with in-house technical expertise.
Key Features of Zabbix
Comprehensive monitoring of networks and applications
Highly customizable alerts and dashboards
Open-source and free to use
Scalable for large environments
Robust community support
Zabbix Pros
Free and open-source
Highly customizable monitoring
Extensive documentation and community resources
No vendor lock-in
Suitable for on-premises deployments
Zabbix Cons
Requires technical expertise to set up and maintain
Steeper learning curve for advanced configurations
Limited out-of-the-box integrations
May require significant customization
Less user-friendly than managed solutions
Zabbix Pricing
Zabbix offers various pricing tiers for its cloud-based solution, starting from $50 per month for the Nano tier, which supports 50 New Values Per Second (NVPS). The pricing scales up to $5,000 per month for the 2xLarge tier, supporting 10,000 NVPS9. For on-premise solutions, Zabbix provides different editions with varying features and support levels.
The Advanced Edition is priced at $18,700 and includes 1 Zabbix server and up to 3 Zabbix proxies. Higher tiers, such as Professional and Expert editions, offer more Zabbix proxies and additional features10. Zabbix also offers a free 30-day trial edition for users to test the full feature set.
FAQs on Datadog Alternatives
1. What are the top alternatives to Datadog?
The top alternatives to Datadog include New Relic, Prometheus, Grafana, Splunk, AppDynamics, LogicMonitor, Dynatrace, and Zabbix. These platforms offer diverse features ranging from deep application analytics to open-source customization, catering to various monitoring needs.
2. Why should I consider using an alternative to Datadog?
You should consider using an alternative to Datadog if you need a solution that better fits your budget, offers specialized analytics, provides deeper customization, or integrates more seamlessly with your existing infrastructure. Each alternative has its unique strengths, so evaluating them based on your specific requirements is crucial.
3. Are Datadog alternatives free to use?
Some Datadog alternatives, such as Prometheus and Zabbix, are open-source and free to use, while others offer free tiers or trials along with paid plans. Your choice will depend on your desired features, scalability needs, and budget.
4. Which Datadog alternative is best for enterprise environments?
For enterprise environments, solutions like Splunk, AppDynamics, Dynatrace, and New Relic offer robust, scalable monitoring with extensive support, advanced analytics, and comprehensive integration capabilities suitable for large, complex infrastructures.
5. Can these alternatives monitor both applications and infrastructure?
Yes, many of these alternatives provide full-stack monitoring capabilities. Platforms such as Dynatrace, New Relic, and AppDynamics are designed to monitor both applications and infrastructure, while tools like Prometheus and Grafana often require integration with other systems to achieve similar results.